Upsets Full Schedule
Explanation of:
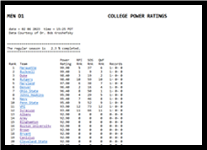
 PR Print Version PR Print Version
|
 RPI Print Version RPI Print Version
|
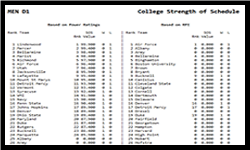 SOS Print Version SOS Print Version
|
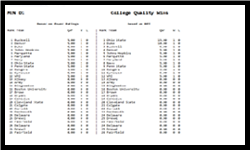 QWF Print Version QWF Print Version
|
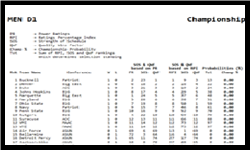 Champ & Selection Print Version Champ & Selection Print Version
|
| Champ % Rank | Team | PR | SOS-PR | QWF-PR | Champ % | RPI | SOS-RPI | QWF-RPI | Selection |
|---|---|---|---|---|---|---|---|---|---|
| 1 | North Carolina ( 22 - 0 ) | 1 | 3 | 1 | 62 . 0 % | 1 | 1 | 1 | 3 |
| 2 | Boston College ( 19 - 3 ) | 2 | 2 | 2 | 28 . 20 % | 2 | 2 | 2 | 6 |
| 3 | Northwestern ( 19 - 3 ) | 3 | 4 | 3 | 6 . 20 % | 3 | 3 | 3 | 9 |
| 4 | Florida ( 20 - 3 ) | 4 | 24 | 4 | 1 . 80 % | 4 | 7 | 4 | 15 |
| 5 | Stanford ( 15 - 6 ) | 8 | 7 | 7 | 0 . 0 % | 7 | 16 | 9 | 32 |
| 6 | Yale ( 16 - 4 ) | 5 | 14 | 5 | 0 . 0 % | 6 | 14 | 5 | 25 |
| 7 | Virginia ( 12 - 7 ) | 15 | 10 | 14 | 0 . 0 % | 9 | 6 | 12 | 27 |
| 8 | Penn ( 12 - 7 ) | 7 | 6 | 10 | 0 . 0 % | 8 | 8 | 13 | 29 |
| 9 | Akron ( 11 - 8 ) | 97 | 113 | 65 | 0 . 0 % | 83 | 108 | 68 | 259 |
| 10 | Albany ( 9 - 10 ) | 49 | 41 | 59 | 0 . 0 % | 49 | 34 | 69 | 152 |
| 11 | American ( 5 - 11 ) | 85 | 76 | 112 | 0 . 0 % | 89 | 75 | 113 | 277 |
| 12 | Arizona State ( 11 - 8 ) | 36 | 34 | 45 | 0 . 0 % | 29 | 39 | 49 | 117 |
| 13 | Army ( 13 - 4 ) | 33 | 43 | 20 | 0 . 0 % | 25 | 47 | 17 | 89 |
| 15 | Binghamton ( 5 - 10 ) | 83 | 73 | 105 | 0 . 0 % | 99 | 83 | 107 | 289 |
| 16 | Boston University ( 8 - 8 ) | 66 | 70 | 66 | 0 . 0 % | 63 | 68 | 61 | 192 |
| 17 | Brown ( 10 - 7 ) | 22 | 23 | 24 | 0 . 0 % | 28 | 20 | 24 | 72 |
| 18 | Bryant ( 11 - 7 ) | 57 | 63 | 53 | 0 . 0 % | 46 | 63 | 57 | 166 |
| 19 | Bucknell ( 6 - 10 ) | 76 | 60 | 96 | 0 . 0 % | 75 | 65 | 93 | 233 |
| 20 | Butler ( 0 - 14 ) | 122 | 75 | 128 | 0 . 0 % | 122 | 96 | 131 | 349 |
| 21 | California ( 6 - 10 ) | 58 | 32 | 70 | 0 . 0 % | 67 | 48 | 72 | 187 |
| 22 | Campbell ( 3 - 12 ) | 86 | 53 | 117 | 0 . 0 % | 102 | 79 | 117 | 298 |
| 23 | Canisius ( 6 - 10 ) | 102 | 98 | 89 | 0 . 0 % | 104 | 104 | 89 | 297 |
| 24 | Central Connecticut ( 2 - 13 ) | 131 | 122 | 119 | 0 . 0 % | 125 | 109 | 119 | 353 |
| 25 | Central Michigan ( 5 - 10 ) | 108 | 92 | 92 | 0 . 0 % | 109 | 119 | 102 | 330 |
| 26 | Cincinnati ( 8 - 9 ) | 60 | 71 | 77 | 0 . 0 % | 72 | 84 | 77 | 233 |
| 27 | Clemson ( 14 - 7 ) | 14 | 16 | 13 | 0 . 0 % | 13 | 4 | 14 | 31 |
| 28 | Coastal Carolina ( 8 - 10 ) | 75 | 81 | 93 | 0 . 0 % | 74 | 76 | 94 | 244 |
| 29 | Colgate ( 9 - 8 ) | 62 | 67 | 73 | 0 . 0 % | 62 | 73 | 73 | 208 |
| 30 | Colorado ( 8 - 8 ) | 30 | 17 | 43 | 0 . 0 % | 27 | 19 | 46 | 92 |
| 31 | Columbia ( 4 - 11 ) | 74 | 36 | 90 | 0 . 0 % | 79 | 50 | 90 | 219 |
| 32 | Connecticut ( 11 - 6 ) | 29 | 44 | 35 | 0 . 0 % | 32 | 33 | 35 | 100 |
| 33 | Cornell ( 9 - 6 ) | 24 | 29 | 26 | 0 . 0 % | 30 | 37 | 28 | 95 |
| 34 | Dartmouth ( 9 - 6 ) | 27 | 20 | 28 | 0 . 0 % | 22 | 25 | 29 | 76 |
| 35 | Davidson ( 12 - 5 ) | 59 | 87 | 33 | 0 . 0 % | 47 | 77 | 31 | 155 |
| 36 | Delaware ( 10 - 6 ) | 42 | 50 | 40 | 0 . 0 % | 34 | 52 | 37 | 123 |
| 37 | Delaware State ( 1 - 14 ) | 133 | 130 | 132 | 0 . 0 % | 131 | 131 | 132 | 394 |
| 38 | Denver ( 14 - 6 ) | 20 | 33 | 25 | 0 . 0 % | 24 | 31 | 27 | 82 |
| 39 | Detroit Mercy ( 6 - 9 ) | 113 | 105 | 87 | 0 . 0 % | 96 | 114 | 87 | 297 |
| 40 | Drexel ( 14 - 4 ) | 26 | 45 | 15 | 0 . 0 % | 21 | 41 | 19 | 81 |
| 41 | Duke ( 14 - 6 ) | 17 | 15 | 11 | 0 . 0 % | 16 | 11 | 7 | 34 |
| 42 | Duquesne ( 5 - 10 ) | 110 | 100 | 106 | 0 . 0 % | 93 | 90 | 103 | 286 |
| 43 | East Carolina ( 7 - 10 ) | 63 | 49 | 81 | 0 . 0 % | 60 | 57 | 79 | 196 |
| 44 | Eastern Michigan ( 8 - 9 ) | 91 | 101 | 80 | 0 . 0 % | 98 | 115 | 82 | 295 |
| 45 | Elon ( 9 - 8 ) | 50 | 42 | 60 | 0 . 0 % | 55 | 54 | 62 | 171 |
| 46 | Fairfield ( 11 - 8 ) | 61 | 72 | 61 | 0 . 0 % | 52 | 56 | 65 | 173 |
| 47 | Fairleigh Dickinson ( 5 - 11 ) | 124 | 131 | 116 | 0 . 0 % | 127 | 130 | 116 | 373 |
| 49 | Furman ( 14 - 4 ) | 79 | 119 | 29 | 0 . 0 % | 65 | 100 | 30 | 195 |
| 50 | Gardner Webb ( 3 - 14 ) | 128 | 115 | 124 | 0 . 0 % | 120 | 106 | 124 | 350 |
| 51 | George Mason ( 7 - 10 ) | 114 | 114 | 97 | 0 . 0 % | 107 | 94 | 95 | 296 |
| 52 | George Washington ( 7 - 9 ) | 100 | 108 | 86 | 0 . 0 % | 100 | 99 | 85 | 284 |
| 53 | Georgetown ( 9 - 8 ) | 39 | 39 | 57 | 0 . 0 % | 53 | 35 | 58 | 146 |
| 54 | Harvard ( 9 - 6 ) | 19 | 19 | 32 | 0 . 0 % | 26 | 28 | 32 | 86 |
| 55 | High Point ( 12 - 6 ) | 53 | 91 | 46 | 0 . 0 % | 56 | 51 | 42 | 149 |
| 56 | Hofstra ( 9 - 7 ) | 55 | 57 | 54 | 0 . 0 % | 57 | 55 | 52 | 164 |
| 57 | Holy Cross ( 10 - 8 ) | 41 | 46 | 67 | 0 . 0 % | 36 | 44 | 63 | 143 |
| 58 | Howard (DC) ( 1 - 14 ) | 132 | 127 | 129 | 0 . 0 % | 130 | 127 | 128 | 385 |
| 59 | Iona ( 9 - 9 ) | 92 | 96 | 82 | 0 . 0 % | 88 | 97 | 83 | 268 |
| 60 | Jacksonville ( 10 - 6 ) | 48 | 64 | 38 | 0 . 0 % | 43 | 49 | 38 | 130 |
| 61 | James Madison ( 14 - 5 ) | 25 | 28 | 12 | 0 . 0 % | 12 | 15 | 11 | 38 |
| 62 | Johns Hopkins ( 13 - 7 ) | 11 | 5 | 9 | 0 . 0 % | 10 | 9 | 10 | 29 |
| 63 | Kennesaw State ( 5 - 11 ) | 112 | 90 | 109 | 0 . 0 % | 97 | 98 | 109 | 304 |
| 64 | Kent State ( 6 - 11 ) | 116 | 117 | 113 | 0 . 0 % | 113 | 129 | 114 | 356 |
| 65 | La Salle ( 1 - 15 ) | 125 | 104 | 133 | 0 . 0 % | 124 | 93 | 133 | 350 |
| 66 | Lafayette ( 6 - 10 ) | 99 | 78 | 98 | 0 . 0 % | 87 | 82 | 96 | 265 |
| 67 | Le Moyne ( 4 - 13 ) | 123 | 121 | 121 | 0 . 0 % | 121 | 111 | 121 | 353 |
| 68 | Lehigh ( 6 - 10 ) | 81 | 55 | 99 | 0 . 0 % | 77 | 67 | 91 | 235 |
| 69 | Liberty ( 12 - 8 ) | 54 | 58 | 51 | 0 . 0 % | 39 | 40 | 43 | 122 |
| 70 | Lindenwood ( 10 - 6 ) | 95 | 111 | 52 | 0 . 0 % | 69 | 118 | 53 | 240 |
| 71 | LIU ( 12 - 7 ) | 104 | 118 | 55 | 0 . 0 % | 68 | 78 | 50 | 196 |
| 72 | Longwood ( 1 - 14 ) | 127 | 109 | 130 | 0 . 0 % | 126 | 112 | 129 | 367 |
| 73 | Louisville ( 7 - 10 ) | 46 | 22 | 62 | 0 . 0 % | 48 | 24 | 64 | 136 |
| 74 | Loyola (MD) ( 13 - 7 ) | 16 | 25 | 23 | 0 . 0 % | 20 | 13 | 18 | 51 |
| 75 | Manhattan ( 2 - 14 ) | 118 | 94 | 126 | 0 . 0 % | 118 | 95 | 126 | 339 |
| 76 | Marist ( 3 - 14 ) | 105 | 84 | 125 | 0 . 0 % | 119 | 105 | 125 | 349 |
| 77 | Marquette ( 10 - 6 ) | 45 | 52 | 36 | 0 . 0 % | 50 | 59 | 40 | 149 |
| 78 | Maryland ( 15 - 6 ) | 10 | 9 | 8 | 0 . 0 % | 11 | 17 | 8 | 36 |
| 79 | Massachusetts ( 15 - 4 ) | 23 | 62 | 16 | 0 . 0 % | 17 | 29 | 15 | 61 |
| 80 | Massachusetts-Lowell ( 11 - 6 ) | 64 | 82 | 41 | 0 . 0 % | 54 | 64 | 41 | 159 |
| 81 | Mercer ( 12 - 8 ) | 56 | 79 | 48 | 0 . 0 % | 51 | 32 | 47 | 130 |
| 82 | Mercyhurst ( 6 - 9 ) | 126 | 129 | 88 | 0 . 0 % | 116 | 126 | 88 | 330 |
| 83 | Merrimack ( 1 - 14 ) | 120 | 110 | 131 | 0 . 0 % | 128 | 113 | 130 | 371 |
| 84 | Michigan ( 13 - 7 ) | 12 | 18 | 17 | 0 . 0 % | 18 | 22 | 23 | 63 |
| 85 | Monmouth (NJ) ( 3 - 13 ) | 87 | 59 | 120 | 0 . 0 % | 111 | 88 | 120 | 319 |
| 86 | Mount St Marys ( 11 - 6 ) | 72 | 89 | 49 | 0 . 0 % | 64 | 107 | 51 | 222 |
| 87 | Navy ( 15 - 6 ) | 21 | 35 | 27 | 0 . 0 % | 19 | 26 | 25 | 70 |
| 88 | New Hampshire ( 2 - 13 ) | 107 | 65 | 123 | 0 . 0 % | 115 | 85 | 123 | 323 |
| 89 | Niagara ( 7 - 11 ) | 93 | 74 | 101 | 0 . 0 % | 80 | 69 | 104 | 253 |
| 90 | Notre Dame ( 7 - 8 ) | 18 | 12 | 34 | 0 . 0 % | 31 | 23 | 36 | 90 |
| 91 | Ohio State ( 8 - 7 ) | 34 | 31 | 42 | 0 . 0 % | 42 | 58 | 44 | 144 |
| 92 | Old Dominion ( 8 - 9 ) | 88 | 103 | 84 | 0 . 0 % | 95 | 101 | 81 | 277 |
| 93 | Oregon ( 6 - 10 ) | 70 | 47 | 78 | 0 . 0 % | 86 | 72 | 80 | 238 |
| 94 | Penn State ( 7 - 9 ) | 31 | 11 | 56 | 0 . 0 % | 33 | 27 | 54 | 114 |
| 95 | Pittsburgh ( 8 - 8 ) | 38 | 27 | 44 | 0 . 0 % | 41 | 46 | 45 | 132 |
| 96 | Presbyterian ( 5 - 12 ) | 129 | 125 | 118 | 0 . 0 % | 123 | 125 | 118 | 366 |
| 97 | Princeton ( 16 - 4 ) | 6 | 8 | 6 | 0 . 0 % | 5 | 10 | 6 | 21 |
| 98 | Queens ( 6 - 11 ) | 89 | 80 | 110 | 0 . 0 % | 82 | 86 | 110 | 278 |
| 99 | Quinnipiac ( 10 - 8 ) | 82 | 95 | 63 | 0 . 0 % | 85 | 92 | 66 | 243 |
| 100 | Radford ( 2 - 14 ) | 130 | 124 | 127 | 0 . 0 % | 129 | 124 | 127 | 380 |
| 101 | Rhode Island ( 8 - 8 ) | 98 | 107 | 75 | 0 . 0 % | 78 | 87 | 76 | 241 |
| 102 | Richmond ( 11 - 8 ) | 47 | 61 | 68 | 0 . 0 % | 38 | 38 | 55 | 131 |
| 103 | Rider ( 8 - 10 ) | 96 | 99 | 94 | 0 . 0 % | 101 | 120 | 97 | 318 |
| 104 | Robert Morris ( 8 - 11 ) | 101 | 102 | 111 | 0 . 0 % | 90 | 116 | 111 | 317 |
| 105 | Rutgers ( 8 - 10 ) | 32 | 21 | 50 | 0 . 0 % | 40 | 18 | 56 | 114 |
| 106 | Sacred Heart ( 6 - 10 ) | 94 | 93 | 102 | 0 . 0 % | 108 | 103 | 105 | 316 |
| 107 | San Diego State ( 5 - 11 ) | 77 | 56 | 107 | 0 . 0 % | 92 | 91 | 108 | 291 |
| 108 | Siena ( 9 - 9 ) | 84 | 86 | 83 | 0 . 0 % | 76 | 74 | 84 | 234 |
| 109 | South Florida ( 13 - 5 ) | 40 | 69 | 30 | 0 . 0 % | 37 | 61 | 26 | 124 |
| 110 | Southern California ( 10 - 7 ) | 28 | 26 | 31 | 0 . 0 % | 35 | 42 | 33 | 110 |
| 111 | St Bonaventure ( 10 - 8 ) | 65 | 88 | 74 | 0 . 0 % | 61 | 80 | 74 | 215 |
| 112 | St Francis ( 7 - 10 ) | 121 | 128 | 100 | 0 . 0 % | 114 | 123 | 100 | 337 |
| 113 | St Josephs (PA) ( 11 - 8 ) | 43 | 54 | 64 | 0 . 0 % | 45 | 43 | 59 | 147 |
| 114 | Stetson ( 5 - 11 ) | 109 | 83 | 103 | 0 . 0 % | 103 | 81 | 106 | 290 |
| 115 | Stonehill ( 11 - 7 ) | 115 | 126 | 58 | 0 . 0 % | 94 | 122 | 60 | 276 |
| 116 | Stony Brook ( 16 - 5 ) | 13 | 30 | 18 | 0 . 0 % | 15 | 21 | 16 | 52 |
| 117 | Syracuse ( 10 - 9 ) | 9 | 1 | 19 | 0 . 0 % | 14 | 5 | 22 | 41 |
| 118 | Temple ( 4 - 12 ) | 71 | 38 | 114 | 0 . 0 % | 71 | 45 | 112 | 228 |
| 119 | Towson ( 7 - 9 ) | 44 | 40 | 72 | 0 . 0 % | 59 | 36 | 70 | 165 |
| 120 | UC Davis ( 6 - 10 ) | 52 | 37 | 76 | 0 . 0 % | 70 | 53 | 78 | 201 |
| 121 | UMBC ( 11 - 5 ) | 67 | 106 | 39 | 0 . 0 % | 66 | 89 | 39 | 194 |
| 122 | UNC-Charlotte ( 6 - 10 ) | 90 | 97 | 104 | 0 . 0 % | 110 | 110 | 98 | 318 |
| 123 | Vanderbilt ( 9 - 9 ) | 51 | 51 | 79 | 0 . 0 % | 58 | 62 | 75 | 195 |
| 124 | VCU ( 8 - 11 ) | 78 | 77 | 108 | 0 . 0 % | 73 | 60 | 101 | 234 |
| 125 | Vermont ( 6 - 9 ) | 80 | 85 | 85 | 0 . 0 % | 84 | 66 | 86 | 236 |
| 126 | Villanova ( 11 - 7 ) | 35 | 48 | 47 | 0 . 0 % | 44 | 30 | 48 | 122 |
| 127 | Virginia Tech ( 9 - 9 ) | 37 | 13 | 37 | 0 . 0 % | 23 | 12 | 34 | 69 |
| 128 | Wagner ( 8 - 7 ) | 119 | 123 | 69 | 0 . 0 % | 91 | 102 | 67 | 260 |
| 129 | William & Mary ( 6 - 10 ) | 73 | 68 | 95 | 0 . 0 % | 81 | 70 | 99 | 250 |
| 130 | Winthrop ( 6 - 11 ) | 117 | 116 | 115 | 0 . 0 % | 117 | 117 | 115 | 349 |
| 131 | Wofford ( 9 - 10 ) | 106 | 112 | 91 | 0 . 0 % | 106 | 121 | 92 | 319 |
| 132 | Xavier ( 2 - 13 ) | 111 | 66 | 122 | 0 . 0 % | 112 | 71 | 122 | 305 |
| 133 | Youngstown State ( 7 - 7 ) | 103 | 120 | 71 | 0 . 0 % | 105 | 128 | 71 | 304 |