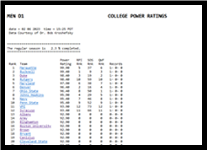
MCLA D1 10 04 23 22:30 PDT College Lacrosse Ratings
Upsets Full Schedule Explanation of:
 PR Print Version PR Print Version
|
 RPI Print Version RPI Print Version
|
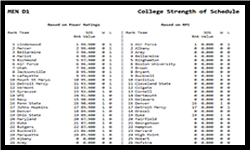 SOS Print Version SOS Print Version
|
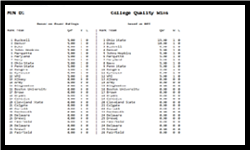 QWF Print Version QWF Print Version
|
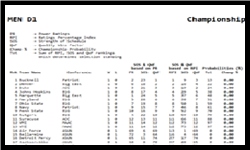 Champ & Selection Print Version Champ & Selection Print Version
|
| Rank | Team | PR | SOS-PR | QWF-PR | Champion % | RPI | SOS-RPI | QWF-RPI | Selection |
|---|---|---|---|---|---|---|---|---|---|
| 1 | Virginia Tech ( 17 - 3 ) | 1 | 17 | 1 | 14 . 50 % | 4 | 2 | 2 | 8 |
| 2 | Concordia-Irvine ( 15 - 5 ) | 2 | 1 | 2 | 13 . 0 % | 2 | 1 | 1 | 4 |
| 3 | Chapman ( 17 - 4 ) | 3 | 6 | 4 | 11 . 50 % | 5 | 3 | 4 | 12 |
| 4 | Brigham Young ( 14 - 7 ) | 8 | 5 | 11 | 7 . 50 % | 8 | 4 | 11 | 23 |
| 5 | Georgia Tech ( 15 - 4 ) | 4 | 7 | 5 | 7 . 50 % | 3 | 12 | 5 | 20 |
| 6 | Georgia ( 14 - 3 ) | 9 | 29 | 7 | 6 . 0 % | 7 | 14 | 7 | 28 |
| 7 | Utah Valley ( 16 - 3 ) | 5 | 11 | 6 | 5 . 0 % | 6 | 18 | 6 | 30 |
| 8 | Liberty ( 15 - 4 ) | 6 | 4 | 3 | 4 . 50 % | 1 | 7 | 3 | 11 |
| 9 | Boston College ( 10 - 3 ) | 7 | 22 | 10 | 4 . 0 % | 13 | 32 | 10 | 55 |
| 10 | Simon Fraser ( 11 - 1 ) | 12 | 44 | 8 | 4 . 0 % | 9 | 44 | 9 | 62 |
| 11 | Arizona State ( 8 - 6 ) | 17 | 8 | 15 | 3 . 0 % | 16 | 28 | 18 | 62 |
| 12 | South Carolina ( 8 - 10 ) | 11 | 2 | 17 | 3 . 0 % | 12 | 10 | 13 | 35 |
| 13 | San Diego State ( 8 - 5 ) | 14 | 15 | 12 | 2 . 50 % | 14 | 39 | 12 | 65 |
| 14 | Florida State ( 10 - 5 ) | 18 | 27 | 16 | 2 . 0 % | 18 | 34 | 16 | 68 |
| 15 | Northeastern ( 11 - 6 ) | 13 | 16 | 18 | 2 . 0 % | 17 | 38 | 19 | 74 |
| 16 | Florida ( 12 - 3 ) | 10 | 23 | 9 | 1 . 50 % | 10 | 27 | 8 | 45 |
| 17 | New Hampshire ( 6 - 7 ) | 25 | 30 | 37 | 0 . 0 % | 44 | 54 | 44 | 142 |
| 18 | Oregon ( 8 - 5 ) | 15 | 51 | 31 | 0 . 0 % | 34 | 37 | 27 | 98 |
| 19 | Texas ( 10 - 3 ) | 22 | 50 | 14 | 0 . 0 % | 11 | 13 | 14 | 38 |
| 20 | UC Santa Barbara ( 9 - 6 ) | 16 | 19 | 19 | 0 . 0 % | 15 | 30 | 17 | 62 |
| 21 | USC ( 5 - 10 ) | 30 | 13 | 53 | 0 . 0 % | 40 | 9 | 56 | 105 |
| 22 | West Virginia ( 8 - 4 ) | 31 | 47 | 25 | 0 . 0 % | 22 | 31 | 24 | 77 |
| 23 | Colorado ( 6 - 7 ) | 20 | 12 | 23 | 0 . 0 % | 20 | 5 | 21 | 46 |
| 24 | Colorado State ( 5 - 9 ) | 28 | 9 | 38 | 0 . 0 % | 29 | 22 | 36 | 87 |
| 25 | Grand Canyon ( 4 - 8 ) | 23 | 3 | 35 | 0 . 0 % | 32 | 25 | 38 | 95 |
| 26 | Temple ( 10 - 6 ) | 32 | 35 | 33 | 0 . 0 % | 21 | 40 | 30 | 91 |
| 27 | Utah ( 6 - 7 ) | 26 | 26 | 49 | 0 . 0 % | 47 | 43 | 50 | 140 |
| 28 | Alabama ( 5 - 7 ) | 60 | 32 | 43 | 0 . 0 % | 46 | 42 | 43 | 131 |
| 29 | Arizona ( 6 - 6 ) | 27 | 25 | 22 | 0 . 0 % | 31 | 19 | 32 | 82 |
| 30 | Arkansas ( 1 - 7 ) | 68 | 70 | 62 | 0 . 0 % | 65 | 55 | 62 | 182 |
| 31 | Auburn ( 8 - 7 ) | 29 | 21 | 26 | 0 . 0 % | 26 | 15 | 31 | 72 |
| 32 | Boise State ( 8 - 5 ) | 24 | 37 | 20 | 0 . 0 % | 30 | 41 | 22 | 93 |
| 33 | Buffalo ( 0 - 10 ) | 66 | 42 | 71 | 0 . 0 % | 72 | 66 | 71 | 209 |
| 34 | Cal Poly ( 8 - 6 ) | 21 | 10 | 13 | 0 . 0 % | 19 | 11 | 15 | 45 |
| 35 | California ( 7 - 7 ) | 19 | 20 | 27 | 0 . 0 % | 23 | 8 | 23 | 54 |
| 36 | Central Florida ( 3 - 9 ) | 62 | 41 | 59 | 0 . 0 % | 52 | 52 | 59 | 163 |
| 37 | Clemson ( 4 - 10 ) | 39 | 14 | 50 | 0 . 0 % | 41 | 6 | 47 | 94 |
| 38 | Connecticut ( 3 - 7 ) | 46 | 28 | 47 | 0 . 0 % | 61 | 71 | 51 | 183 |
| 39 | Dominican ( 7 - 8 ) | 37 | 38 | 56 | 0 . 0 % | 43 | 23 | 54 | 120 |
| 40 | East Carolina ( 2 - 10 ) | 63 | 53 | 73 | 0 . 0 % | 66 | 48 | 73 | 187 |
| 41 | Illinois ( 6 - 9 ) | 54 | 67 | 60 | 0 . 0 % | 53 | 69 | 60 | 182 |
| 42 | Indiana ( 3 - 5 ) | 50 | 60 | 48 | 0 . 0 % | 54 | 56 | 48 | 158 |
| 43 | Iowa State ( 6 - 7 ) | 57 | 72 | 30 | 0 . 0 % | 58 | 62 | 33 | 153 |
| 44 | James Madison ( 5 - 7 ) | 36 | 31 | 39 | 0 . 0 % | 35 | 17 | 37 | 89 |
| 45 | Kansas ( 10 - 4 ) | 56 | 73 | 36 | 0 . 0 % | 57 | 72 | 34 | 163 |
| 46 | LSU ( 10 - 4 ) | 48 | 68 | 29 | 0 . 0 % | 36 | 57 | 25 | 118 |
| 47 | Miami (Ohio) ( 3 - 6 ) | 59 | 58 | 40 | 0 . 0 % | 59 | 63 | 39 | 161 |
| 48 | Michigan State ( 6 - 6 ) | 41 | 40 | 34 | 0 . 0 % | 37 | 26 | 35 | 98 |
| 49 | Minnesota ( 8 - 5 ) | 40 | 57 | 24 | 0 . 0 % | 33 | 35 | 26 | 94 |
| 50 | Missouri ( 11 - 4 ) | 47 | 69 | 21 | 0 . 0 % | 27 | 70 | 20 | 117 |
| 51 | NC State ( 7 - 7 ) | 44 | 34 | 41 | 0 . 0 % | 39 | 36 | 40 | 115 |
| 52 | Nebraska ( 0 - 9 ) | 69 | 56 | 63 | 0 . 0 % | 71 | 60 | 63 | 194 |
| 53 | Nevada ( 4 - 6 ) | 65 | 48 | 57 | 0 . 0 % | 62 | 64 | 57 | 183 |
| 54 | Oklahoma ( 6 - 8 ) | 67 | 71 | 68 | 0 . 0 % | 63 | 59 | 64 | 186 |
| 55 | Ole Miss ( 3 - 8 ) | 70 | 66 | 66 | 0 . 0 % | 68 | 49 | 65 | 182 |
| 56 | Oregon State ( 4 - 9 ) | 64 | 52 | 64 | 0 . 0 % | 64 | 61 | 66 | 191 |
| 57 | Pittsburgh ( 6 - 7 ) | 52 | 46 | 51 | 0 . 0 % | 45 | 50 | 49 | 144 |
| 58 | Purdue ( 7 - 9 ) | 53 | 65 | 69 | 0 . 0 % | 51 | 68 | 69 | 188 |
| 59 | Santa Clara ( 3 - 7 ) | 33 | 18 | 44 | 0 . 0 % | 38 | 21 | 45 | 104 |
| 60 | Sonoma State ( 7 - 7 ) | 42 | 43 | 55 | 0 . 0 % | 49 | 58 | 52 | 159 |
| 61 | South Florida ( 4 - 8 ) | 51 | 49 | 52 | 0 . 0 % | 56 | 51 | 53 | 160 |
| 62 | Southern Methodist ( 12 - 5 ) | 38 | 63 | 32 | 0 . 0 % | 24 | 24 | 28 | 76 |
| 63 | Stanford ( 2 - 8 ) | 61 | 54 | 67 | 0 . 0 % | 69 | 67 | 67 | 203 |
| 64 | Tennessee ( 9 - 6 ) | 35 | 39 | 28 | 0 . 0 % | 25 | 33 | 29 | 87 |
| 65 | Texas A&M ( 7 - 7 ) | 43 | 59 | 58 | 0 . 0 % | 42 | 29 | 55 | 126 |
| 66 | Texas Christian ( 6 - 6 ) | 34 | 45 | 45 | 0 . 0 % | 28 | 16 | 41 | 85 |
| 67 | Texas State ( 4 - 9 ) | 71 | 61 | 72 | 0 . 0 % | 67 | 65 | 72 | 204 |
| 68 | Texas Tech ( 0 - 4 ) | 73 | 64 | 46 | 0 . 0 % | 70 | 53 | 46 | 169 |
| 69 | UCLA ( 3 - 10 ) | 49 | 24 | 61 | 0 . 0 % | 55 | 45 | 61 | 161 |
| 70 | Vanderbilt ( 3 - 7 ) | 58 | 36 | 42 | 0 . 0 % | 50 | 20 | 42 | 112 |
| 71 | Washington ( 5 - 7 ) | 45 | 33 | 54 | 0 . 0 % | 48 | 46 | 58 | 152 |
| 72 | Washington State ( 3 - 9 ) | 72 | 62 | 65 | 0 . 0 % | 73 | 73 | 68 | 214 |
| 73 | Western Michigan ( 3 - 10 ) | 55 | 55 | 70 | 0 . 0 % | 60 | 47 | 70 | 177 |