MEN D1 09 26 23 10:12 PDT College Lacrosse Ratings
This is the PR Method Switch to the RPI Method Full Schedule Upsets
|
Power Rating (PR) Explanation |
Strength Of Schedule (SOS) Explanation |
Quality Wins Factor(QWF) Explanation |
Championship Probability Explanation |
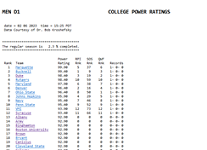 Power Ratings (PR) Power Ratings (PR)Print Version |
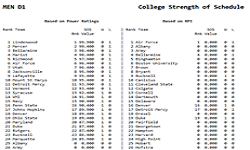 Strength Of Schedule (SOS) Strength Of Schedule (SOS)Print Version |
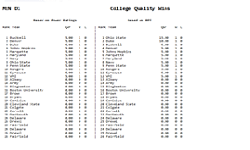 Quality Win Factor (QWF) Quality Win Factor (QWF)Print Version |
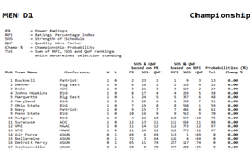 Champ & Selection Champ & SelectionPrint Version |