NJ Group 4 05 28 26 08:18 PDT High School Lacrosse Ratings
Upsets Full Schedule
Explanation of:
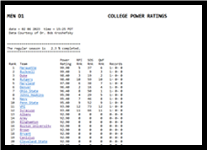 Rating Percentage Index(RPI) Rating Percentage Index(RPI)Print Version |
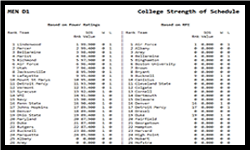 Strength Of Schedule (SOS) Strength Of Schedule (SOS)Print Version |
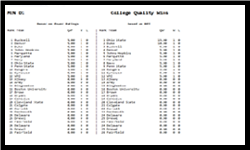 Quality Win Factor (QWF) Quality Win Factor (QWF)Print Version |
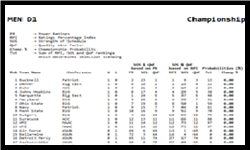 Championship ChampionshipPrint Version |
| Champ % Rank | Team | RPI | SOS | QWF | Championship % |
|---|---|---|---|---|---|
| 1 | Old Bridge ( 15 - 4 ) | 4 | 12 | 1 | 17 . 77 % |
| 2 | Southern Regional ( 14 - 4 ) | 26 | 41 | 17 | 14 . 44 % |
| 3 | Passaic County Tech ( 12 - 6 ) | 33 | 39 | 16 | 11 . 11 % |
| 4 | Manalapan ( 10 - 8 ) | 2 | 36 | 8 | 9 . 99 % |
| 5 | Morristown ( 16 - 5 ) | 1 | 8 | 2 | 7 . 77 % |
| 6 | Westfield ( 15 - 5 ) | 3 | 45 | 5 | 7 . 77 % |
| 7 | Freehold Township ( 11 - 7 ) | 18 | 34 | 24 | 5 . 55 % |
| 8 | Howell ( 10 - 7 ) | 9 | 27 | 12 | 5 . 55 % |
| 9 | Ridgewood ( 16 - 4 ) | 16 | 29 | 9 | 5 . 55 % |
| 10 | Cherokee ( 12 - 5 ) | 5 | 11 | 3 | 4 . 44 % |
| 11 | Lenape ( 8 - 8 ) | 6 | 4 | 4 | 3 . 33 % |
| 12 | Bridgewater-Raritan ( 8 - 12 ) | 25 | 6 | 28 | 1 . 11 % |
| 13 | Columbia ( 6 - 12 ) | 17 | 26 | 15 | 1 . 11 % |
| 14 | Fair Lawn ( 11 - 7 ) | 39 | 33 | 23 | 1 . 11 % |
| 15 | Livingston ( 6 - 13 ) | 24 | 35 | 26 | 1 . 11 % |
| 16 | Marlboro ( 11 - 9 ) | 40 | 21 | 42 | 1 . 11 % |
| 17 | South Brunswick ( 14 - 6 ) | 15 | 16 | 10 | 1 . 11 % |
| 18 | Atlantic City ( 5 - 7 ) | 45 | 30 | 31 | 0 . 0 % |
| 19 | Bergen Tech ( 9 - 6 ) | 14 | 31 | 11 | 0 . 0 % |
| 20 | Cherry Hill East ( 2 - 15 ) | 37 | 32 | 39 | 0 . 0 % |
| 21 | Clifton ( 5 - 13 ) | 22 | 17 | 32 | 0 . 0 % |
| 22 | East Brunswick ( 9 - 10 ) | 11 | 20 | 18 | 0 . 0 % |
| 23 | East Side Newark ( 0 - 12 ) | 41 | 24 | 43 | 0 . 0 % |
| 24 | Eastern Regional ( 6 - 11 ) | 10 | 5 | 7 | 0 . 0 % |
| 25 | Edison ( 6 - 11 ) | 32 | 22 | 44 | 0 . 0 % |
| 26 | Egg Harbor Twp ( 5 - 12 ) | 35 | 23 | 33 | 0 . 0 % |
| 27 | Hillsborough ( 10 - 8 ) | 36 | 7 | 41 | 0 . 0 % |
| 28 | Hunterdon Central ( 14 - 5 ) | 13 | 14 | 6 | 0 . 0 % |
| 29 | Irvington ( 4 - 10 ) | 34 | 28 | 27 | 0 . 0 % |
| 30 | JP Stevens ( 3 - 11 ) | 43 | 25 | 45 | 0 . 0 % |
| 31 | Kingsway ( 6 - 11 ) | 8 | 18 | 25 | 0 . 0 % |
| 32 | Millville ( 2 - 12 ) | 44 | 37 | 35 | 0 . 0 % |
| 33 | Monroe Township ( 11 - 9 ) | 12 | 9 | 13 | 0 . 0 % |
| 34 | Montclair HS ( 8 - 10 ) | 7 | 1 | 19 | 0 . 0 % |
| 35 | Montgomery ( 14 - 4 ) | 19 | 38 | 20 | 0 . 0 % |
| 36 | North Brunswick ( 2 - 18 ) | 31 | 10 | 46 | 0 . 0 % |
| 37 | Phillipsburg ( 11 - 7 ) | 46 | 40 | 37 | 0 . 0 % |
| 38 | Rancocas Valley ( 6 - 12 ) | 21 | 2 | 29 | 0 . 0 % |
| 39 | Saddle Brook/Garfield ( 1 - 10 ) | 38 | 3 | 38 | 0 . 0 % |
| 40 | Sayreville ( 8 - 11 ) | 23 | 15 | 40 | 0 . 0 % |
| 41 | Toms River North ( 12 - 8 ) | 28 | 13 | 34 | 0 . 0 % |
| 42 | Washington Township ( 10 - 7 ) | 20 | 19 | 21 | 0 . 0 % |
| 43 | Watchung Hills ( 17 - 2 ) | 42 | 42 | 14 | 0 . 0 % |
| 44 | West Orange ( 3 - 13 ) | 29 | 43 | 22 | 0 . 0 % |
| 45 | West Windsor-PB South ( 4 - 16 ) | 27 | 44 | 36 | 0 . 0 % |
| 46 | Williamstown ( 4 - 12 ) | 30 | 46 | 30 | 0 . 0 % |